MADD → Master Data Design
How can designers make sense of this mad MADD world?
A hands on experience crafting data through design to make a change.

start date — September 2024
end date — July 2025
course lenght — 400 hours
ETCS — 60 credits
language — English
schedule*
— Monday, Tuesday, Wednesday and Thursday
— from 5pm to 9.15pm
— workshops from Monday to Friday
*For academic reasons, sessions may be scheduled exceptionally outside these hours.
tuition fee
Academic year 24-25
13,150€
(plus 500€ in registration fees)
leading team
Pau García, Codirector
Paadín, Codirector
Marc Panero, Codirector
Thais Caballero, Coordinator
introduction
So, now that we’ve access to almost everything, anywhere, anytime… Do we know the world any better? We generated, collected and stored more data last year than in the 5.000 previous years of recorded human history… and we’re about to double down on that course.
Unfortunately, that doesn’t mean that our societies are better informed. Data alone masks the reality it describes, blurs meaning and dumbs down emotions.
It’s hard to figure out what two degrees of average temperature rise means, or a transmission rate of 1.5… or one million deaths, for that matter.
In a world of flat-earthers, ‘alternative facts’ and AI generated imagery, transforming data into comprehensible and honest information is, more than a bare necessity, a matter of societal survival.
In the MADD we explore design, data analysis, visualization and storytelling practices to create projects beyond classical formats. We work to understand how we can generate transcendent information, in a moment when climate change is an opinion, disinformation floods social media and AI is about to render obsolete millions of works and forms of processing knowledge.
Our role as designers is key to create the tools that will help our societies navigate this chaotic scenario. At MADD we’ll learn to design comprehensible and empathic systems, able to extract meaning and to communicate using a wide range of tools alongside a team of teachers, active professionals, with a passion for what they do and a joy for sharing.
At MADD we do collaborate. Creatives, designers, social scientists and all the professionals teaching lectures, courses and workshops work closely with the participants, ushering them in the process of bringing their ideas to light and making them happen.
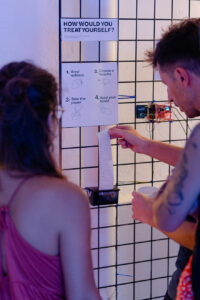
We will work on hands-on projects, combining theoretical reflection and debate with active participation, we will have express – “just do it” oriented– capsules and workshops. A great variety of experiences and partners, so you can create projects of great visibility that are relevant to you from the first moment.
Above all, pushing the margins of design, unorthodoxy, discovery and exploration will mark a learning experience focused on a range of very diverse topics; as much as the participants themselves.
We will seek to create real connections between people and information, between design and content, to offer the world new ways of thinking. We will highlight stories, real ones, not Instagram’s. Well… those too.
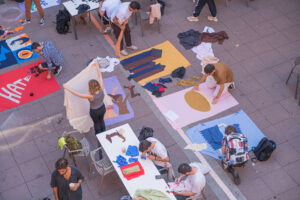
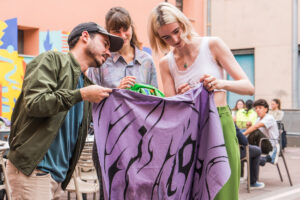
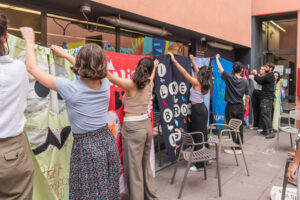
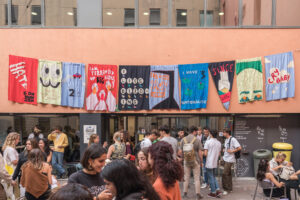
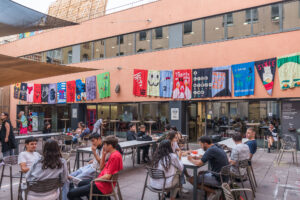
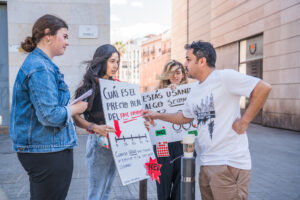
The city of Barcelona will be the backdrop and stage of this experience of critical spirit; We will go out on the street and the street will enter the master’s degree.
So… Do you want to make sense of this MADD world with us?
our values
Data is one of the main engines of the world; Society will increasingly need designers who know how to work with it, treat it honestly and turn it into beauty.
Teamwork
Designers always work in teams. Big or small, multidisciplinary or not, collective work is the core of our practice; To know how to behave and interact with colleagues, clients or suppliers is an integral part of the design process.
Practical approach
Through a constant and intense practical approach (yes, even in those more theoretical classes), the experts and professionals in charge of the subjects will share their tools and know-how not only to learn but, also and above all, to put the acquired skills into practice.
Critical thinking
How can we be good designers without questioning the world we live in?
We firmly believe in the value of being critical, always trying to find the reasons behind our certainties and constantly looking for a way to improve.
From design
Design is a transversal discipline capable of affecting and influencing very different realities and contexts; that’s how we understand it. It is not just a way of doing things, but also a way of thinking with infinite possibilities. This approach will boost your master’s experience; you will see very different methods and forms of design, and you will understand their adaptability and power to influence reality.
featured projects
methodology
The designer of the future will be able to approach symbols as we approach the reality they represent. If you read and speak through data, you will be able to understand and shape part of our world.
You will be part of a committed and motivated group of designers, researchers, thinkers and storytellers in a hands-on collaborative learning experience. You will be able to develop your ideas, working on projects tackling real problems.
We will address very different disciplines: from sociology, communication strategy or cartography, to audiovisual research methods and data science.
We will crossover them with a critical perspective and grounded always in design methodology.
Together we will answer questions like …
— How can data influence our perception of reality?
— How can we analyze data and work with it in a productive way?
— How flexible is data and in how many ways can we represent it?
— How can data and design help communities shed some light on and improve their realities?

Ane Guerra
Letraherida
Teaches Edition and Creative Writing in the MED and Storytelling in the MADD


Toni Llàcer
Teaches Research and Context in the MVD, Theoretical and Methodological Research Framework in the MADD, and Understanding (De)growth and Visions in the MBP

guest teachers and lecturers
workshops 23.24
Edgar Pons
Rafa Castanyer
Matteo Moretti, Sheldon Studio
Veronika Gryshchuk & Thinh Truong
Olga Subirós & Gerald Kogler
Domestic Data Streamers
graphic.elisava lectures 23.24
Martin Lorenz, TwoPoints
Giliane Cachin
Samar Maakaroun, Pentagram
Julia Born
Julie Peeters
Anette Lenz
masters’ interdisciplinary workshops 23.24
Victor Guerithault, KiteLab
Christoph Brach, Raw Color
Sonja Stummerer & Martin Hablesreiter, Honey and Bunny
masters’ talks 23.24
Alice Rawsthorn
Yazmany Arboleda
Kaave Pour, SPACE10
Elric Petit & Augustin Scott de Martinville, BIG-GAME
Irma Boom
Eyal Weizman, Forensic Architecture

study plan
1
Foundations
↓
Six modules will provide a basis and a shared perspective on Information Design and Data Visualization, while we think on what kind of images we produce and put them in practice.
1.1
Data as Raw Material — Statistics
→
↓
Data analysis is the first step of our work. Extracting meaning from cold facts, recognizing patterns, reaching informed conclusions and representing it all in the most suitable way is essential in an open yet rigorous approach to data
1.2
Space as Data — Cartography
→
↓
Maps are the foundation of many information design projects, both as a complementary source and as a tool for better understanding. We’ll learn about the use of cartography and its cultural significance and we will begin to familiarize ourselves with the basic concepts of mapmaking.
1.3
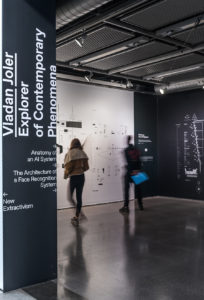
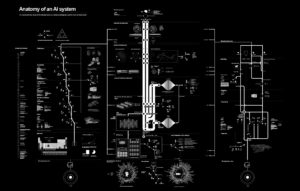
Relationships as Data — Systems
→
↓
How do we explain relationships between things?
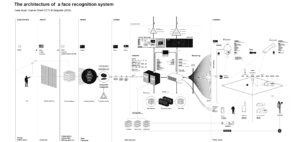
The representation of systems, the graphic synthesis of multiple aspects of one problem are a fundamental part of Information design. This class provides an introduction to the representation of complex phenomena, systems and networks: from the simple presentation of time to the visualization of the complex communities that are shaped by social networks.
1.4
Data Visualization
→
↓
An introduction to data visualization and infographics, bringing together key concepts and methodologies that can be applied to any project. Students will work with a wide range of information graphics with focus on common graphs, maps, diagrams, and charts, how and when to use them, and how to interpret them.
1.5
Data Analysis
→
↓
The first step of every data design project is the preliminary analysis. This express capsule will set us in the starting point –the use of spreadsheets– leveling the base for everybody.
1.6
Designing with Data
→
↓
In coordination with Data Analysis and building up from the work done, we will model a design process that will work as a template for all projects. A quick and dirty how-to for communicating with data.
Data analysis is the first step of our work. Extracting meaning from cold facts, recognizing patterns, reaching informed conclusions and representing it all in the most suitable way is essential in an open yet rigorous approach to data
Maps are the foundation of many information design projects, both as a complementary source and as a tool for better understanding. We’ll learn about the use of cartography and its cultural significance and we will begin to familiarize ourselves with the basic concepts of mapmaking.
How do we explain relationships between things?
The representation of systems, the graphic synthesis of multiple aspects of one problem are a fundamental part of Information design. This class provides an introduction to the representation of complex phenomena, systems and networks: from the simple presentation of time to the visualization of the complex communities that are shaped by social networks.
An introduction to data visualization and infographics, bringing together key concepts and methodologies that can be applied to any project. Students will work with a wide range of information graphics with focus on common graphs, maps, diagrams, and charts, how and when to use them, and how to interpret them.
The first step of every data design project is the preliminary analysis. This express capsule will set us in the starting point –the use of spreadsheets– leveling the base for everybody.
In coordination with Data Analysis and building up from the work done, we will model a design process that will work as a template for all projects. A quick and dirty how-to for communicating with data.
2
Master Project
↓
During a whole semester, you will have the opportunity to make you ideas come true, put into practice what you have learned during the course and use the city of Barcelona as a field for experimentation, data collection and laboratory.
2.1
Data Experience
→
↓
You will develop a personal design project that explores how to create meaningful ways of connecting people and information through a multidisciplinary approach.
The main objective of this subject is to develop design projects that are able to have a human approach to data and communication; to bring to reality projects that use data-science but also qualitative and ethnographic research methods that uncover people’s emotions, stories, and models of their world.
2.2
Research Framework
→
↓
In this module, you will be required to research and analyze relevant theories and methodologies related to your project. This will involve reviewing literature and identifying relevant theories and methods that can be applied to your research. You will also need to consider the limitations and potential biases of these approaches and how they may impact your project. The goal of this module is to provide a solid theoretical and methodological foundation for your project, enabling you to make informed and well-supported decisions about your design and communication strategies.
2.3
Data Report
→
↓
What it’s not recorded is lost. While developing your project, we will generate a report of sorts, a companion to your Data Experience where you can fit everything that might be left out otherwise. It will work as a proper part of the project, as an archive, as a creative process log where we’ll fit documentation, thoughts, interviews… whatever complements and reinforces your work and makes it relatable to others
2.4
Data Communication
→
↓
The main objective of this course is to create a communication campaign around the joint exhibition, exploring how to expand it conceptually and narratively before, after, and beyond the event itself. Our weapons will be contemporary, radical advertising and graphic design, critical thinking, meta languages, irony, guerrilla, and whatever we come up with during the mind-blowing brainstorming sessions. Because we may blow our minds, but we’ll do it with a good sense of humor and a rooted strategic mindset.
You will develop a personal design project that explores how to create meaningful ways of connecting people and information through a multidisciplinary approach.
The main objective of this subject is to develop design projects that are able to have a human approach to data and communication; to bring to reality projects that use data-science but also qualitative and ethnographic research methods that uncover people’s emotions, stories, and models of their world.
In this module, you will be required to research and analyze relevant theories and methodologies related to your project. This will involve reviewing literature and identifying relevant theories and methods that can be applied to your research. You will also need to consider the limitations and potential biases of these approaches and how they may impact your project. The goal of this module is to provide a solid theoretical and methodological foundation for your project, enabling you to make informed and well-supported decisions about your design and communication strategies.
What it’s not recorded is lost. While developing your project, we will generate a report of sorts, a companion to your Data Experience where you can fit everything that might be left out otherwise. It will work as a proper part of the project, as an archive, as a creative process log where we’ll fit documentation, thoughts, interviews… whatever complements and reinforces your work and makes it relatable to others
The main objective of this course is to create a communication campaign around the joint exhibition, exploring how to expand it conceptually and narratively before, after, and beyond the event itself. Our weapons will be contemporary, radical advertising and graphic design, critical thinking, meta languages, irony, guerrilla, and whatever we come up with during the mind-blowing brainstorming sessions. Because we may blow our minds, but we’ll do it with a good sense of humor and a rooted strategic mindset.
3
Perspectives
↓
Things don’t just happen; the information that we live surrounded by has been mediated and handpicked, it has context and purpose. We will study the design of information through a critical lens, with the certainty that it can be read in many ways and affects us in many others. Sociology, philosophy, and cultural analysis will help us shed some inquisitive light on a world made up of information.
3.1
Critical Media
→
↓
Understanding the emergent, accidental and amorphous nature of our networked planet implies a transdisciplinary approach, and some of our traditional assumptions need to be challenged. A collective exercise to review what it means to be human and its relationship with what we call nature and technology. As traditional categories are failing to grasp our ever-changing present, we won’t hesitate to experiment with concepts and ideas, as well as taking the risk to jump into the blurriness.
3.2
Data Boundaries
→
↓
A practical examination of strategies to uncover, describe, map, inhabit, and even rethink data-based systems. Our society, and planet Earth in general, has turned into a multi-layered, opaque and often accidental entangle- ment of infrastructures, protocols and lifeforms. We use them to observe and they observe us. By exploring the back alleys and the irregular stitching of the megamachine we’ll be able to tell different stories, expose injustice, and conjure up alternatives.
3.3
Data x Common Good
→
↓
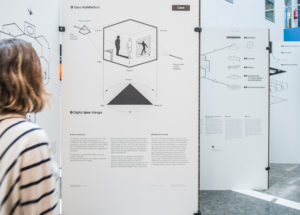
In this first part of a three faceted course we will discuss with relevant guests – from architects to sociologists – how data is shaping our society and if it can be steered for the common good. This would be the first step on a process that after a practical workshop will end up being a collective piece to exhibit in the Barcelona Architectures Festival.
3.4
Data Representation
→
↓
Data Visualization we call it… but they are just pictures. We look at a simple line-graph like we look at a photo of our last holiday. It proves something: – I was there – and tells something – this is how I want you to see me. In this course we will examine and practice the graphic representation of data from its very abstract basics to the subtleties of its meaning and the elusive intentions of its authors.
3.5
Storytelling
→
↓
We are made of stories (and bones and water, but also stories). We understand societies through them; they have been the traditional way of explaining the world. From mythology to Netflix, tales are embedded in our DNA. Therefore, it’s very important to learn how they work; stories will make designs and projects relatable to others, and they will help spread game changing ideas in a reality that is now more demanding than ever.
3.6
Audiovisual
→
↓
Information plus time equals movies. Beyond infographics and motion graphics, the moving image uses simple techniques –as old as cinema itself– constantly renewing them to new purposes. We will study the history and practice of the audiovisual media as a vehicle for data. Through comparison, transformation, accumulation, editing or manipulation of speed and scale, the moving image is a perfect vehicle for communicating the complexities and nuances of data.
Understanding the emergent, accidental and amorphous nature of our networked planet implies a transdisciplinary approach, and some of our traditional assumptions need to be challenged. A collective exercise to review what it means to be human and its relationship with what we call nature and technology. As traditional categories are failing to grasp our ever-changing present, we won’t hesitate to experiment with concepts and ideas, as well as taking the risk to jump into the blurriness.
A practical examination of strategies to uncover, describe, map, inhabit, and even rethink data-based systems. Our society, and planet Earth in general, has turned into a multi-layered, opaque and often accidental entangle- ment of infrastructures, protocols and lifeforms. We use them to observe and they observe us. By exploring the back alleys and the irregular stitching of the megamachine we’ll be able to tell different stories, expose injustice, and conjure up alternatives.
In this first part of a three faceted course we will discuss with relevant guests – from architects to sociologists – how data is shaping our society and if it can be steered for the common good. This would be the first step on a process that after a practical workshop will end up being a collective piece to exhibit in the Barcelona Architectures Festival.
Data Visualization we call it… but they are just pictures. We look at a simple line-graph like we look at a photo of our last holiday. It proves something: – I was there – and tells something – this is how I want you to see me. In this course we will examine and practice the graphic representation of data from its very abstract basics to the subtleties of its meaning and the elusive intentions of its authors.
We are made of stories (and bones and water, but also stories). We understand societies through them; they have been the traditional way of explaining the world. From mythology to Netflix, tales are embedded in our DNA. Therefore, it’s very important to learn how they work; stories will make designs and projects relatable to others, and they will help spread game changing ideas in a reality that is now more demanding than ever.
Information plus time equals movies. Beyond infographics and motion graphics, the moving image uses simple techniques –as old as cinema itself– constantly renewing them to new purposes. We will study the history and practice of the audiovisual media as a vehicle for data. Through comparison, transformation, accumulation, editing or manipulation of speed and scale, the moving image is a perfect vehicle for communicating the complexities and nuances of data.
4
Projects
↓
Information design is like a “matryoshka”; within each problem are smaller individual problems. We will work on some of them with the help of experts in tutored projects that address specific topics.
4.1
Data Collection
→
↓
We will analyze the data collected with the sensors built in the first part of the program to complete the project, extracting conclusions and building, using several tools, a functional website that allows the public to explore the results of our investigation.
4.2
Visual Explanation
→
↓
Good design can make abstract issues understandable despite differences in language and culture or format constraints. We’ll embark on practical project aimed to be published. We will design an infographic spread page under professional conditions with the guidance of Gemma Busquets.
4.3
Data x Common Good - Exhibition
→
↓
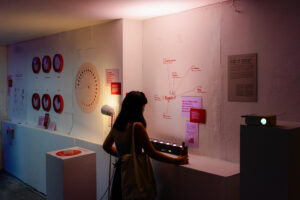
The final part of this multi-module series will be creating an exhibition that summarizes and expands the results of the previous workshop and course.
We will analyze the data collected with the sensors built in the first part of the program to complete the project, extracting conclusions and building, using several tools, a functional website that allows the public to explore the results of our investigation.
Good design can make abstract issues understandable despite differences in language and culture or format constraints. We’ll embark on practical project aimed to be published. We will design an infographic spread page under professional conditions with the guidance of Gemma Busquets.
The final part of this multi-module series will be creating an exhibition that summarizes and expands the results of the previous workshop and course.
5
Workshops
↓
Learning by doing: intensive and practical design experiences on central problems of data design.
5.1
Homemade DataViz
→
↓
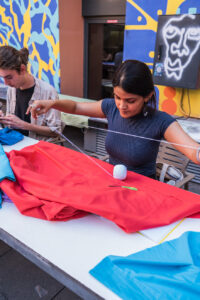
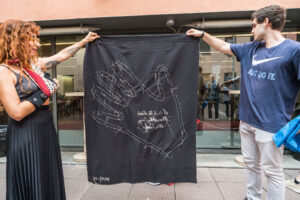
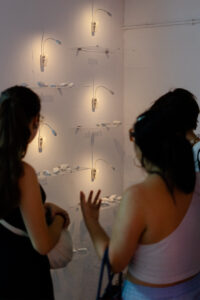
Analogue representations are a mediation not just a simple instrument.They generate an experience between observer and information. Statistics aren’t something you can touch and turning them into abstract physical shapes can help to understand data and more importantly, have a new and relevant experience with it.
5.2
Data Collection Workshop - Artificial Senses
→
↓
We live surrounded by sensors and displays gathering, analyzing and visualizing all kinds of information. In this two part program we will use technology, in the best DIY spirit, to work with data from the ground up, from the very beginning of the process. We will learn the basics of programming in Arduino and Raspberry, how to choose the best platform to solve a technological project and the basics to hack an analog automatism to be applied to a data visualization project.
5.3
Data Journalism
→
↓
An interdisciplinary practice which combines editorial design, UX, web design, data visualization, interaction design, visual storytelling, and narrative to explain the complexity of contemporary phenomena to a broader audience in a more engaging and approachable way.
5.4
Data x Common Good - Workshop
→
↓
We will focus on one particular urban problem and develop a data based approach. A hands-on workshop that will focus in Barcelona as the place of conflict and data as a way to tackle it.
5.5
Data & Photo
→
↓
Photography is simultaneusly a way of collecting and representing data. It has been developing alongside graphic data visualization since its birth in the XIX century. What will happen to that relationship now , in the age of sinthetic creation?
5.6
Degree Show
→
↓
The last MADD workshop consists of showing the public the experiences of the course through different for- mats. In this case, the students are faced with a real and complete expository and editorial project, an intense process that takes place in a tight time and that culminates in the Degree Show.
Analogue representations are a mediation not just a simple instrument.They generate an experience between observer and information. Statistics aren’t something you can touch and turning them into abstract physical shapes can help to understand data and more importantly, have a new and relevant experience with it.
We live surrounded by sensors and displays gathering, analyzing and visualizing all kinds of information. In this two part program we will use technology, in the best DIY spirit, to work with data from the ground up, from the very beginning of the process. We will learn the basics of programming in Arduino and Raspberry, how to choose the best platform to solve a technological project and the basics to hack an analog automatism to be applied to a data visualization project.
An interdisciplinary practice which combines editorial design, UX, web design, data visualization, interaction design, visual storytelling, and narrative to explain the complexity of contemporary phenomena to a broader audience in a more engaging and approachable way.
We will focus on one particular urban problem and develop a data based approach. A hands-on workshop that will focus in Barcelona as the place of conflict and data as a way to tackle it.
Photography is simultaneusly a way of collecting and representing data. It has been developing alongside graphic data visualization since its birth in the XIX century. What will happen to that relationship now , in the age of sinthetic creation?
The last MADD workshop consists of showing the public the experiences of the course through different for- mats. In this case, the students are faced with a real and complete expository and editorial project, an intense process that takes place in a tight time and that culminates in the Degree Show.
6
Capsules
↓
Data is everywhere; in how we move and what we listen to. We will explore different fields in which data and information are present and, also, how they configure their environment.
6.1
Data & Drawing
→
↓
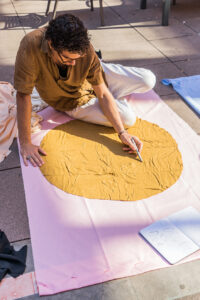
The human gaze has been, since prehistoric times, a data collection tool. What we see and describe contains all the information we can name… and all the information we can sense. We will use the methods and tools of drawing to turn that sensitive knowledge into expression, to turn data into information that inevitably contains emotions and desires.
6.2
Data & Performance
→
↓
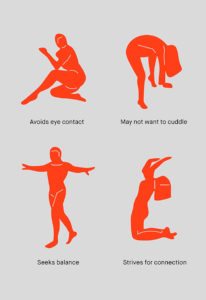
Blurring the boundaries between disciplines is one of the foundations of the MADD. Our voice, our bodies are tools and the space we inhabit is our medium in this bold approach to data visualization.
6.3
Data & Sound
→
↓
The aim of this project is to create a device that represents the state of the world in any given minute – compressing time and using recognisable, everyday objects to visualize our impact in the world telling a story. From the mundane to the cataclysmic we will create a multi-scale representation of our world – a data based soundscape – that gets data closer to the participant.
The human gaze has been, since prehistoric times, a data collection tool. What we see and describe contains all the information we can name… and all the information we can sense. We will use the methods and tools of drawing to turn that sensitive knowledge into expression, to turn data into information that inevitably contains emotions and desires.
Blurring the boundaries between disciplines is one of the foundations of the MADD. Our voice, our bodies are tools and the space we inhabit is our medium in this bold approach to data visualization.
The aim of this project is to create a device that represents the state of the world in any given minute – compressing time and using recognisable, everyday objects to visualize our impact in the world telling a story. From the mundane to the cataclysmic we will create a multi-scale representation of our world – a data based soundscape – that gets data closer to the participant.
7
Events
↓
To listen is to learn. Specially, when professionals, emerging or consolidated, share their life experience through their professional career. Inspiration has to find you working, but also listening.
7.1
International Lectures
→
↓
We invite prestigious international designers to speak at lectures that allow us to learn about experiences, projects and case studies of different fields of design first hand.
7.2
Masters' Talks
→
↓
We organize talks with famous creators of different fields that allow us to share experiences, observe design phenomena, obtain new ways of looking at things, reflections and references that enrich our interdisciplinary perspective of design.
We invite prestigious international designers to speak at lectures that allow us to learn about experiences, projects and case studies of different fields of design first hand.
We organize talks with famous creators of different fields that allow us to share experiences, observe design phenomena, obtain new ways of looking at things, reflections and references that enrich our interdisciplinary perspective of design.
In the interest of continuous improvement to the programme and the professional qualifications of our teachers, we reserve the right to make changes to the content and faculty of the Master’s programme.
experience
“MADD means devoting time to analyzing what you currently do and what you want to do next. The master’s degree offers an unusual set of resources that are key to interpreting reality and collaborating in its construction, using data as a material and design as a tool.” Paula López-Nuño, MADD 20
A 4 day trip to a hackathon
MADD offers the possibility to seek inspiration on a 4-day hackathon trip* to a European city where you will have the possibility to work day and night hand in hand with your classmates and your teachers. We will develop a real project and put into practice everything you have been learning during the previous months.
* Not included in the registration.
Barcelona: urban lab
Barcelona is an amazing place to live and work.It is a thriving ecosystem of creative people, design studios with different cultures and ideas. She is open minded and understands the design. Barcelona will be our laboratory, the place to research, create, develop and design.
Work on real projects creating a real impact between communities
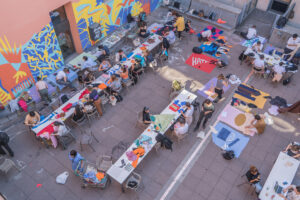
Design is an applied discipline. One of the main objectives of MADD is to work through active learning based mainly on simulations inspired by real projects. This will allow us to understand and assess the tricks and real possibilities of the discipline and apply, from day one, everything you learn to your work.
A city by and for design
Barcelona is known for its passion for design (and for the bad sangria on the Rambla, but we’ll talk about that another day). It is a city with a great diversity of nuances in gastronomy, culture and events, which is perfectly complemented by the master’s degree. Barcelona will inspire you and make your learning a complete experience.
practical info
Who is it for?
Due to its particular transdisciplinary nature, MADD is open to professionals and students from different educational backgrounds and experiences. It is mainly aimed at:
– Graphic designers
– Journalists and editors
– Social scientists
– Digital Product Designers
– Architects and urban planners
…
Knowledge or experience required
A bachelor’s degree is not essential to take this master’s degree; we value professional experience as much as college education. If you still have doubts about whether you would fit in or not, just go ahead, submit your request and we will resolve it on a case-by-case basis.
Degree
Master’s Degree in Data & Design, degree awarded by Universitat de Vic – Universitat Central de Catalunya (UVic-UCC) and ELISAVA Barcelona School of Design and Engineering.
Editions and languages
A single edition of the MADD, Master Data & Design is held each academic year. The course is taught in English.
Number of students
Each year a maximum of 20 students are selected. Once the registration period is open, there is a rolling candidate selection process as preregistrations become effective.